1 Air traffic statistics and forecasts
1.1 EUROCONTROL recommended values
The EUROCONTROL Statistics and Forecast (STATFOR) service produces flight and service unit forecasts of future network traffic with a view to help planners understand and manage risks, identify bottlenecks, and anticipate the needs of airspace users.
1.1.1 Medium-term forecast (7-year timespan)
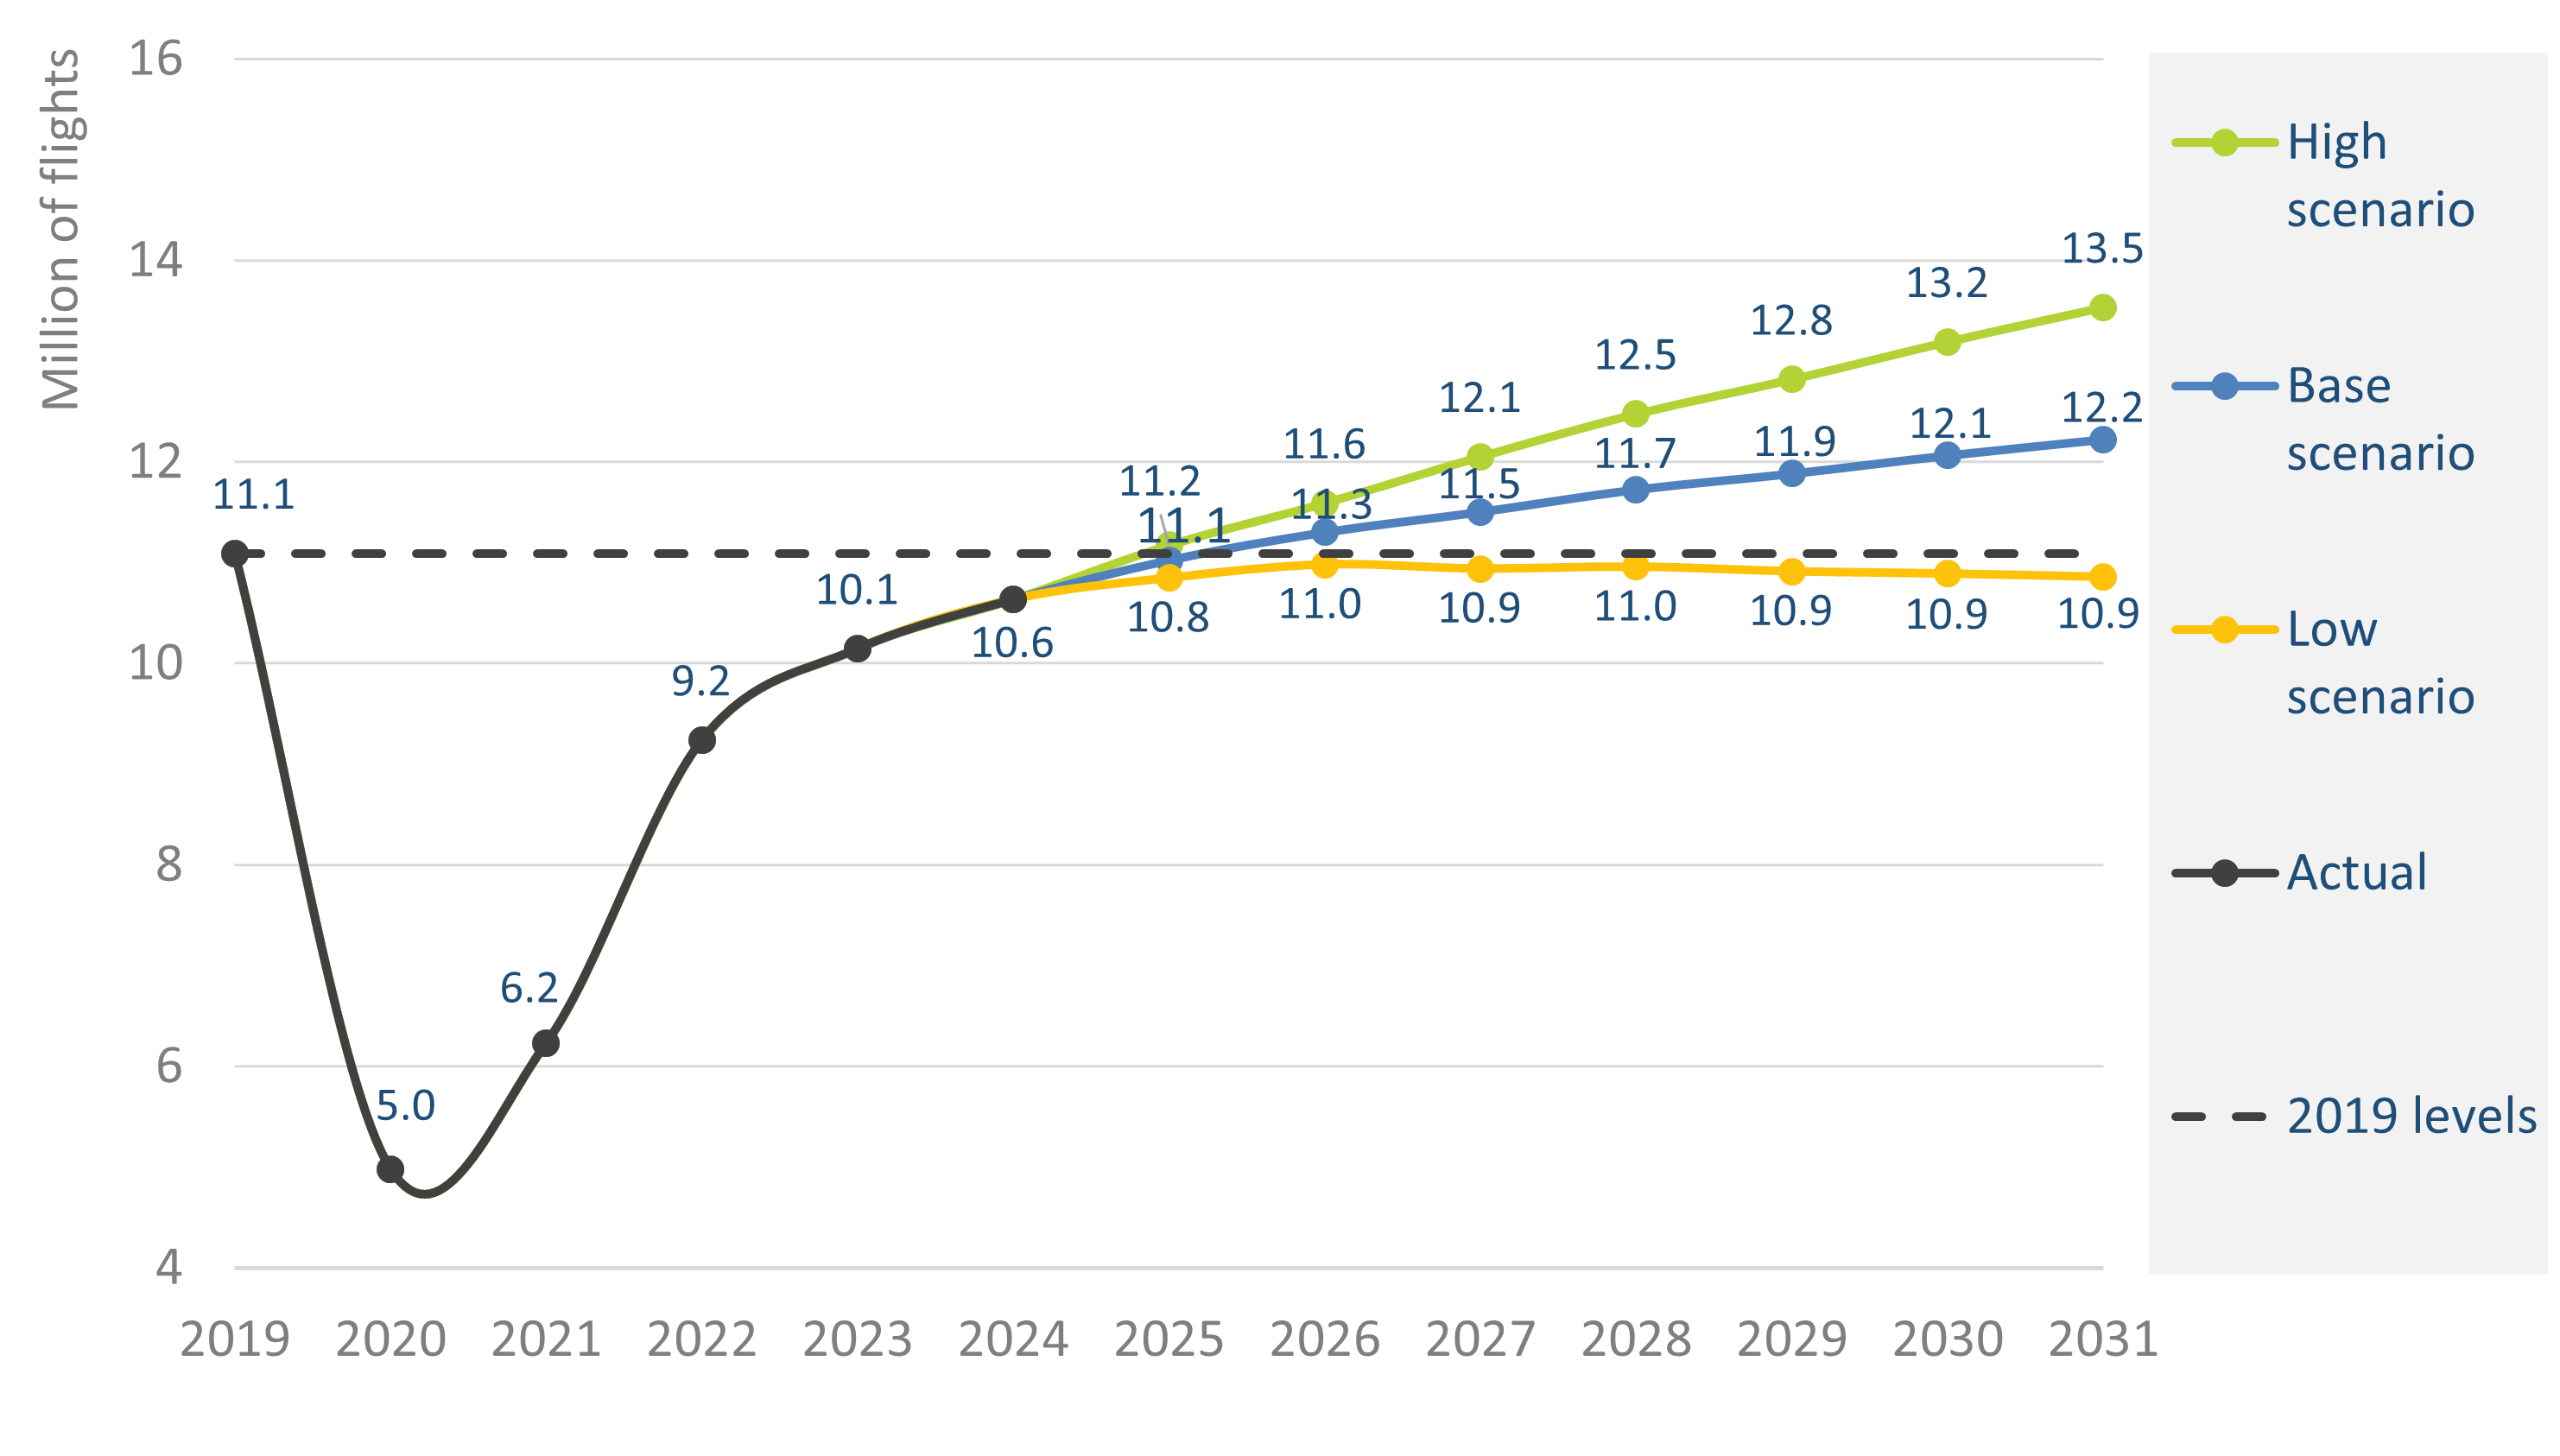
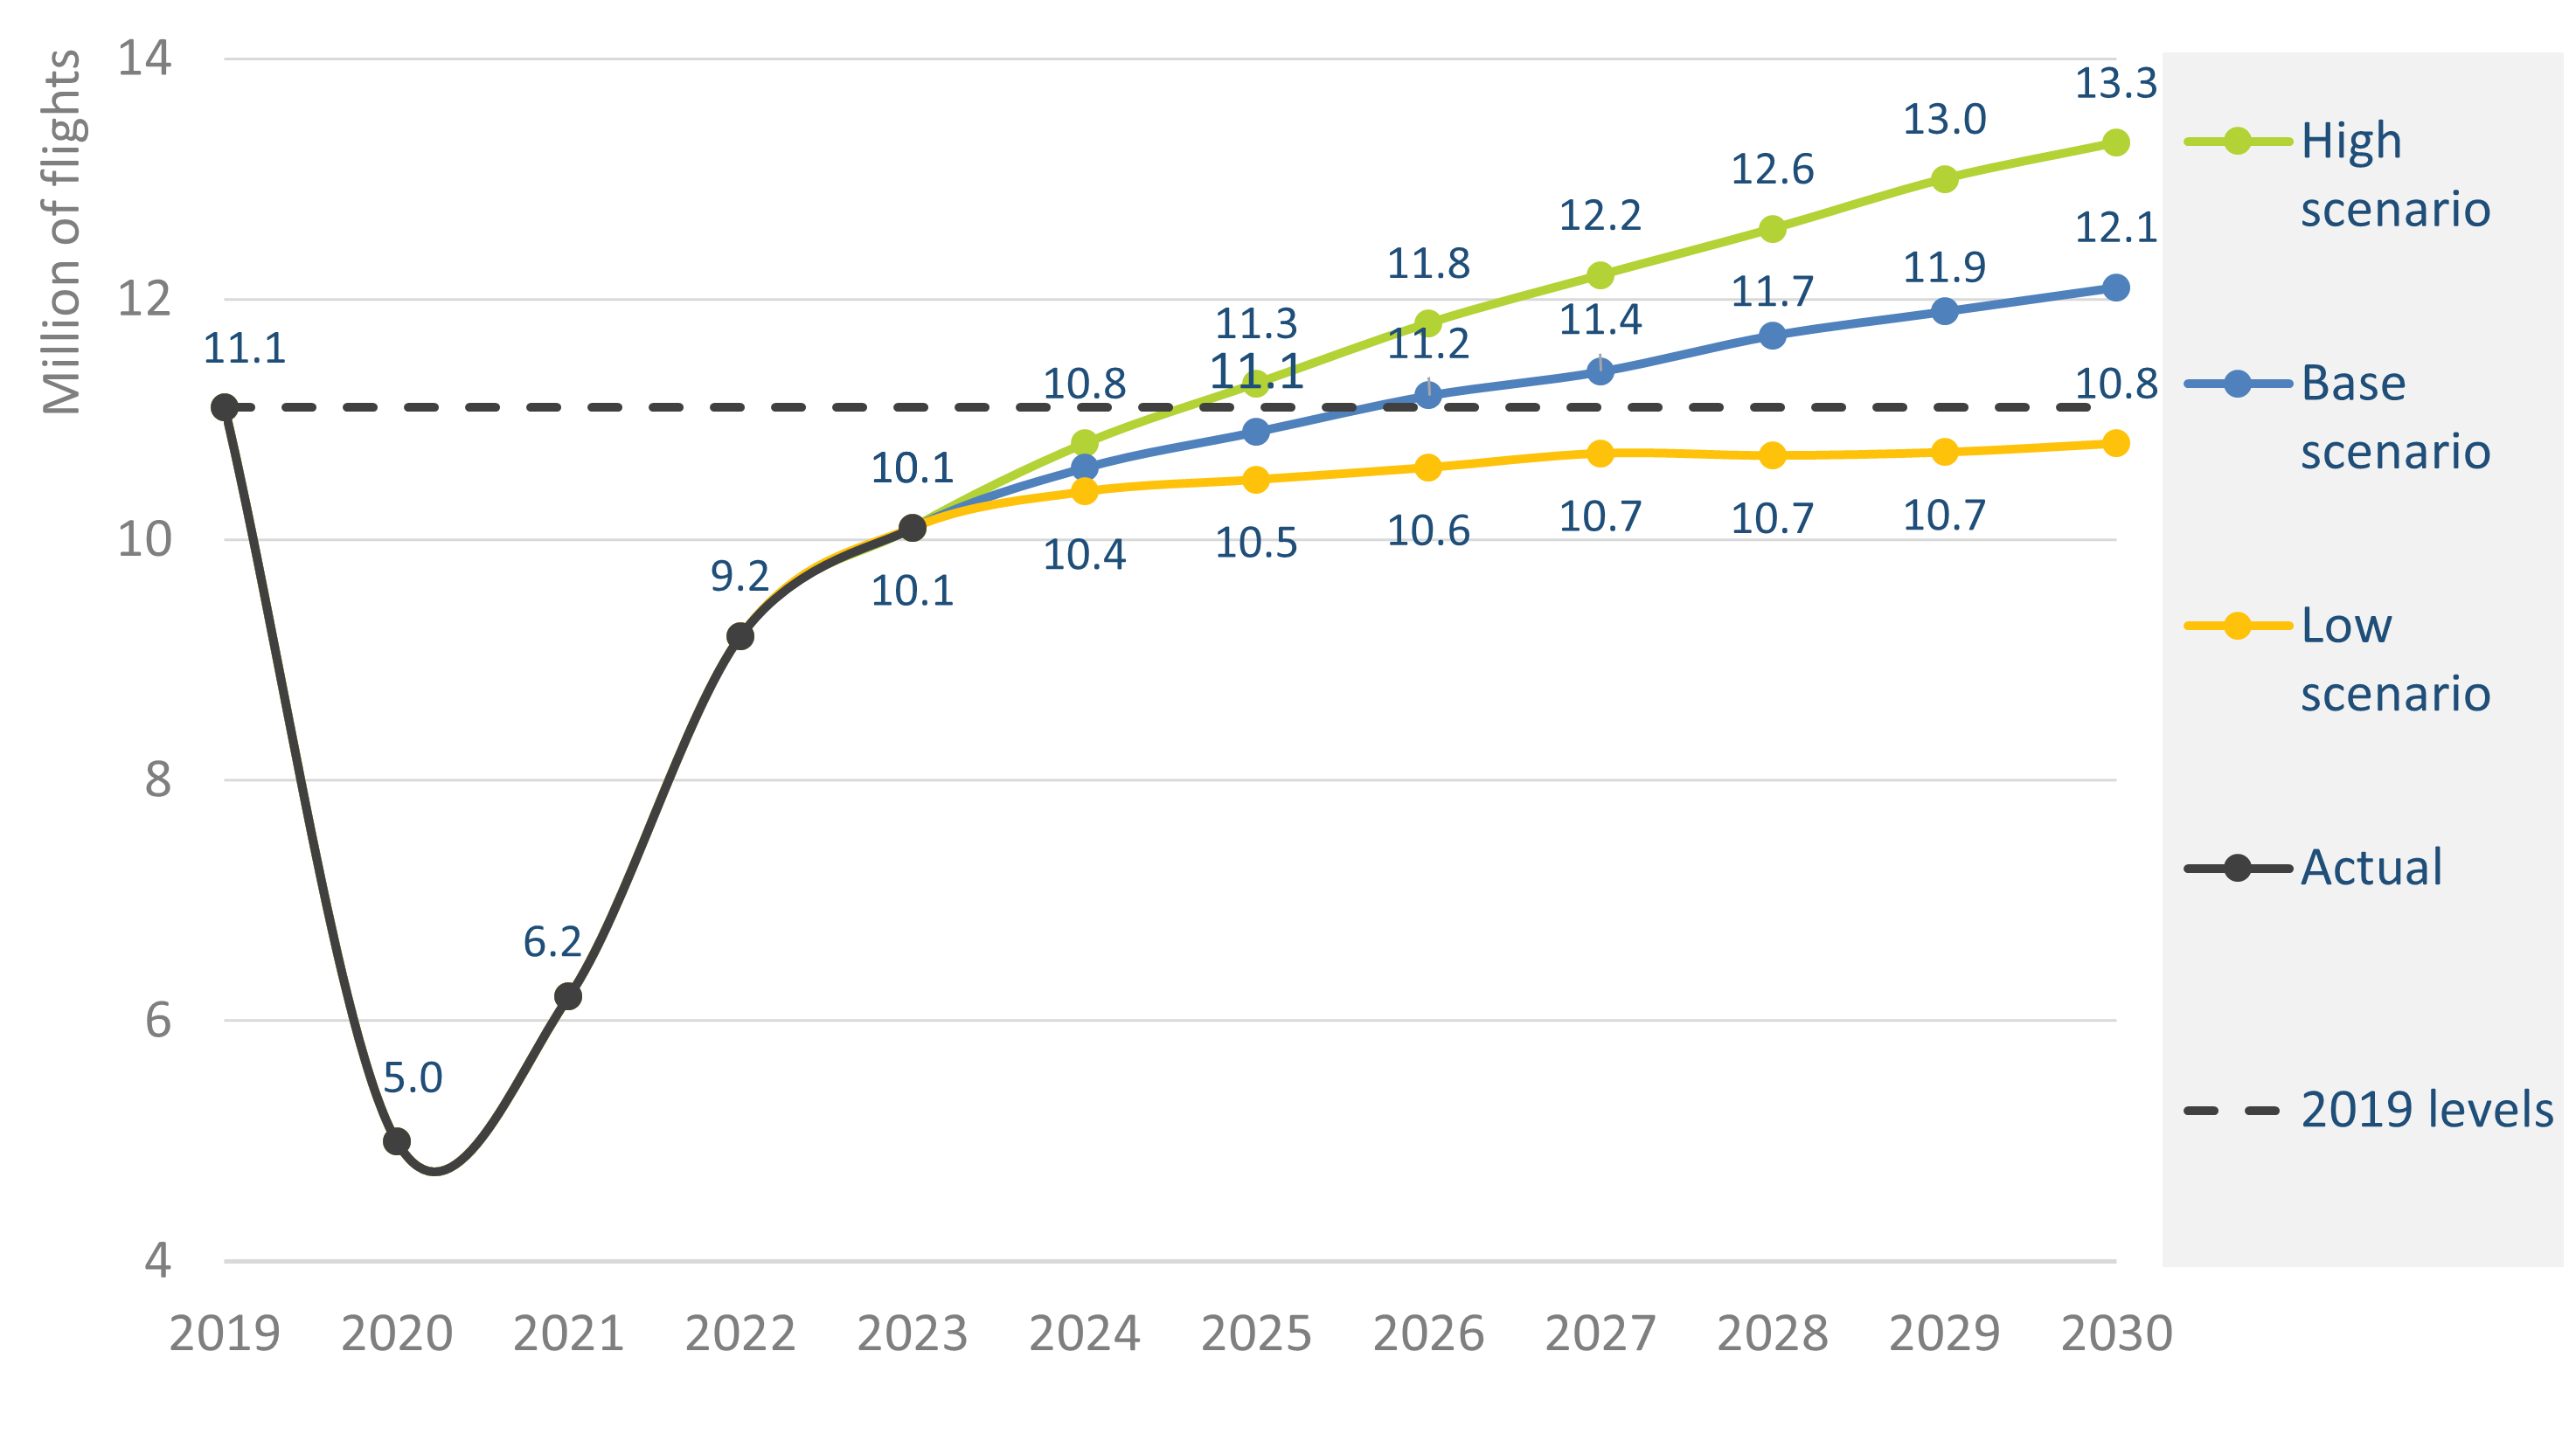
The medium-term forecasts give a comprehensive picture of anticipated air traffic development in Europe (i.e. ECAC) for the next seven years. These forecasts combine flight statistics with economic growth and models of other industry drivers, including costs, airport capacity, passenger numbers, load factors and aircraft size. Using high and low growth scenarios, they present a likely range for growth, to help planners manage risks.
These forecasts are published biannually, in spring and autumn, covering flights, en-route and terminal service units and the latest forecast can always be found on the STATFOR page.

The above graph shows the traffic forecast taking account of the impact of the COVID-19 pandemic. In the base scenario, IFR flights are expected to be back to 2019 levels by 2026. Traffic statistics and forecasts can be obtained directly from the STATFOR Interactive Dashboard (SID)[2].
1.1.2 Long-term forecast (20 to 30-year timespan)
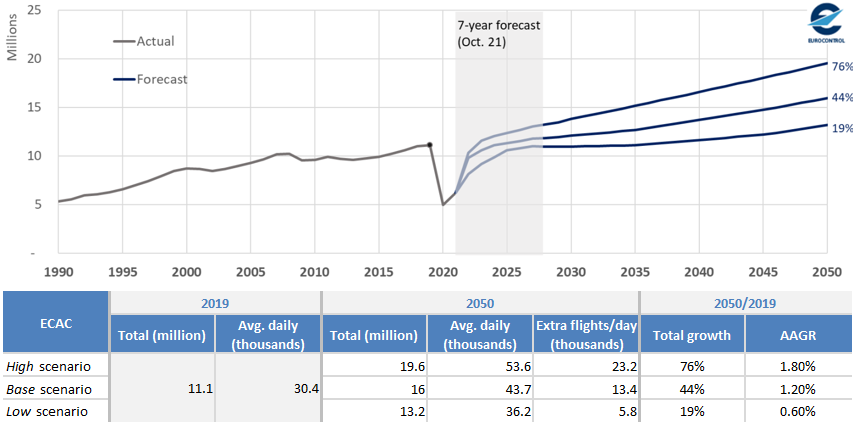
Twenty to thirty-year forecasts look at a range of distinct possible scenarios for how the air traffic industry might look in 20-30 years’ time.
This allows a range of “what if?” questions to be explored, for factors inside the industry (e.g. the growth of small business jets, or of point-to-point traffic) or outside the industry (e.g. the price of oil or environmental constraints).
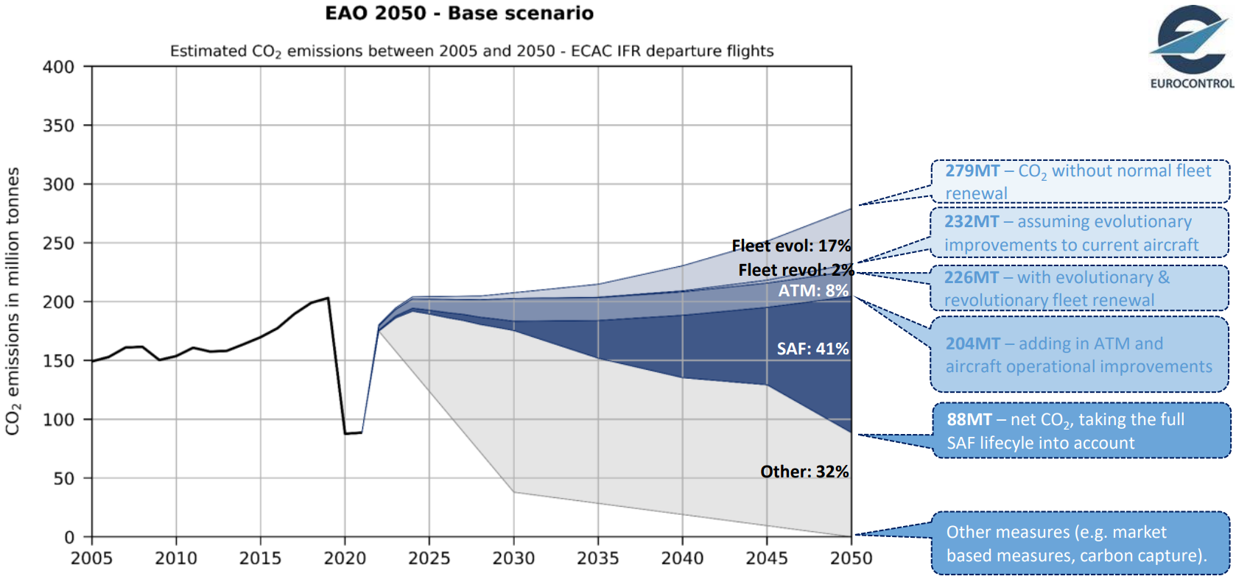
Twenty to thirty-year forecasts are usually published every two to three years. In April 2022, EUROCONTROL published its first EUROCONTROL Aviation Outlook (EAO) looking out to 2050, much further than previous forecasts. This forecast estimates a future number of flights and CO2 emissions per scenario, in line with aviation’s objective of achieving net-zero CO2 emissions by that date.

In the most-likely Base scenario, the forecast is for 15.4 million flights in Europe in 2050, 39% more than in 2019 – average growth of 1.1% per year.
Furthermore, Figure 1.3 shows the estimated evolution of CO2 emissions between 2005 and 2050. According to this data, by 2050, CO2 emissions, net of sustainable aviation fuel (SAF), fleet and operational improvements, will be reduced by about 63% compared to the baseline in the Base scenario.

1.1.3 Service units forecasts
Service Units are billed to airlines for the provision of air-traffic services. They are of two types:
En-route Traffic Service Units (TSU) that are taxed for the provision of en-route air traffic control and are a function of the weight and the distance flown within each state over which the concerned aircraft flies.
Terminal Navigation Service Units (TNSU) are taxed for the provision of ground services to the airlines for each departure at a given airport. They are a function of the weight of the considered aircraft.
EUROCONTROL produces a 7-year forecast of Service Units that builds on the 7-year IFR movements forecast, by adding forecasts of the aircraft weights and distances. This Service Units forecast is provided to states that are part of the Central Route Charges Office (CRCO) to help them set-up their en-route unit rates, if needed. The Forecast of Service Units in general serves also as a benchmark for the European Commission to assess the financial aspects of the performance plans of the states that are bound by the Performance and Charging Schemes according to EU regulations (EU) N°2019/317.

The above graph shows the en-route service units forecast taking account of the impact of COVID-19.
1.2 When to use the inputs?
The objective of STATFOR is to provide statistics and forecasts on IFR flight movements and service units in Europe (ECAC) and to monitor and analyse the evolution of the air transport industry.