4 Air traffic delay
4.1 EUROCONTROL recommended values
The sections below present the evolution in reported delays taking two perspectives:
The view of airlines and passengers considering all causes of delay
A zoom-in to the view of the Network Manager focusing on Air Traffic Flow Management (ATFM) delays
4.1.1 All causes of delay
Figure 4.1 presents an overview of all causes of delay reported by the airlines in 2021 and 2022. The figures presented are estimated by the EUROCONTROL Central Office of Delay Analysis (CODA) and are calculated based on the comparison of the scheduled and actual flight timings. They can be used in studies that look into the different causes of flight delay experienced by passengers and airlines.
More information can be accessed via CODA Interactive Dashboard
The ATFM delay (en-route, airport and weather) constitutes only a fraction of primary delay from all causes, and around half of all delay is reactionary (i.e. delay caused by late arrival of aircraft, crew, passengers, or baggage from previous journeys) rather than primary (i.e. delay other than reactionary).
4.1.2 ATFM delay
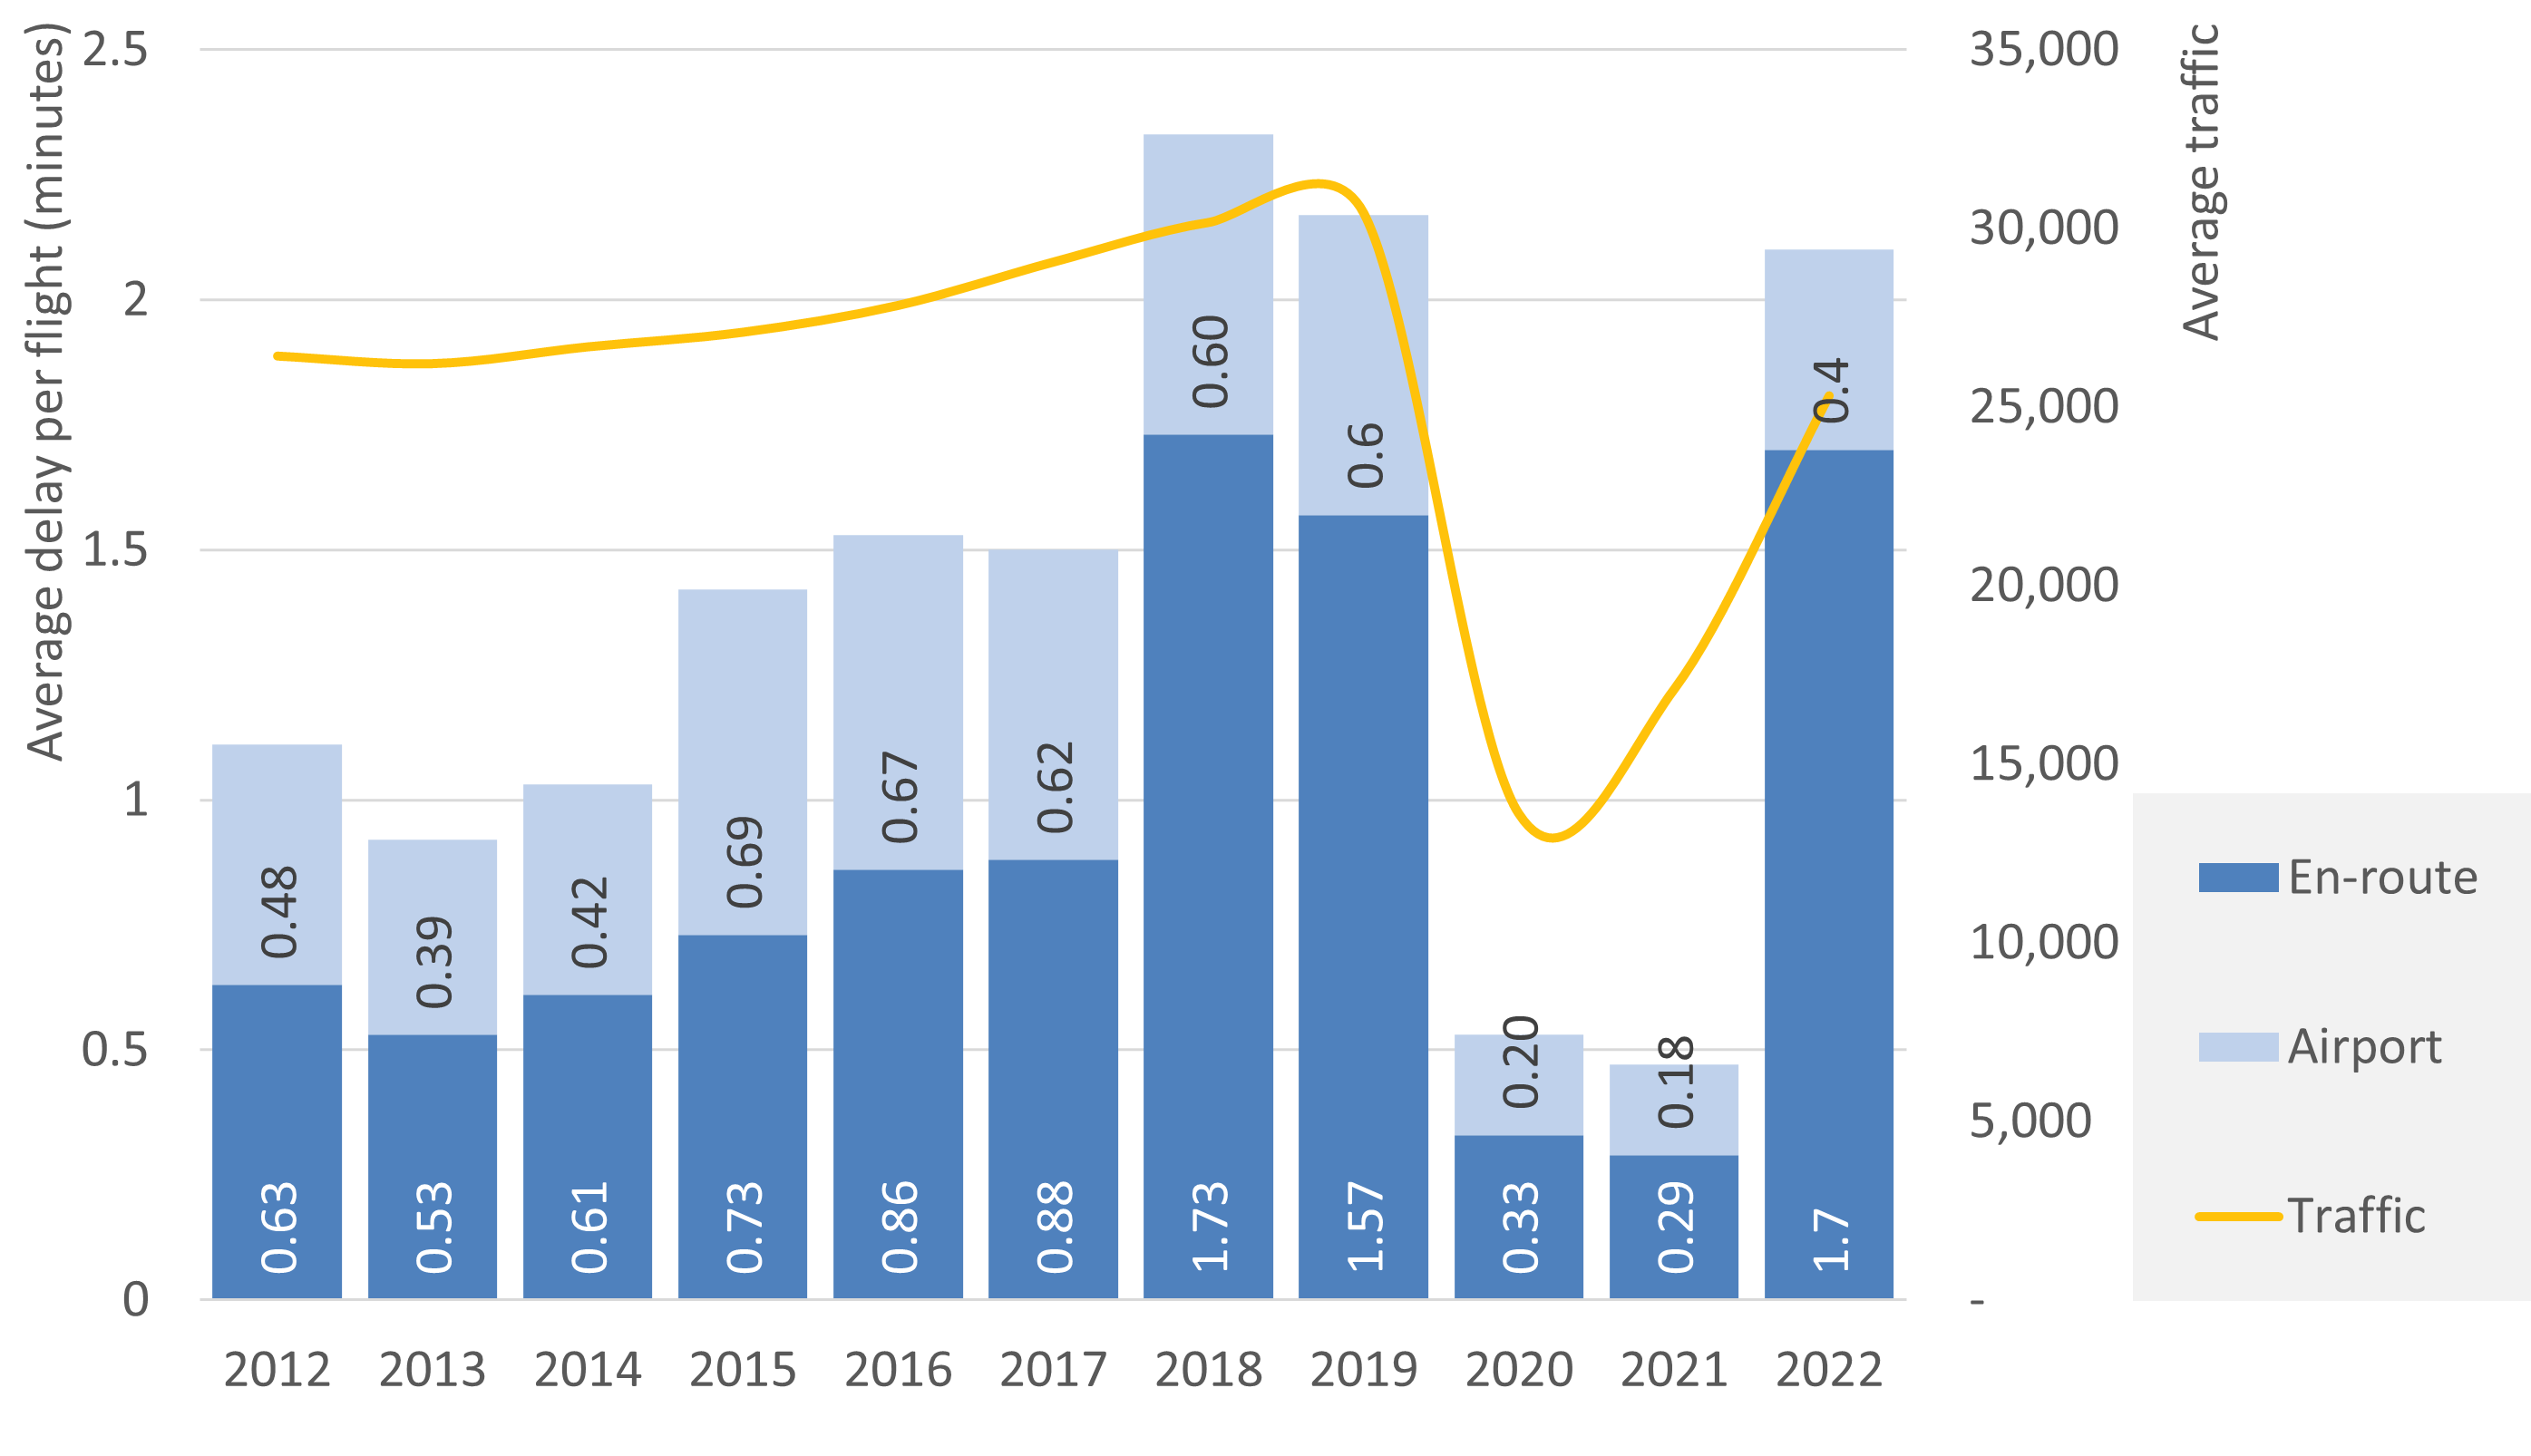
Looking specifically into ATFM delay, Figure 4.2 shows the average daily traffic and average ATFM delay per flight (en-route and at airport) for the period 2012-2022. The figures presented are calculated by the Network Manager based on the flight plans and include the planned ATFM delays due to restrictions that may be applied in the airspace.

4.2 Comment
Looking at both figures above, it can be observed that the ATFM delay, both at the airport and en-route, is higher when looking at the numbers provided by the airlines rather than that observed by the Network Manager. This is because the delay numbers provided by the Network Manager account for the planned delay due to restrictions in the airspace, while the numbers provided by the airlines cover the total delay, they attribute to ATFM, whether they come from the restrictions or any other planned ATFM delays, such as ATM system upgrades, training activities, etc.
Another important point to take into consideration when analysing the recommended values is the impact of COVID-19 pandemic. Both, the all-causes delay and the ATFM delay were impacted by the significant reduction in air traffic in 2020 and 2021, resulting in a strong drop in the total delay duration. Thus, when looking into these numbers it is equally important to consider the situation prior to 2020. For the All-causes delay this information can be found in the previous editions of CODA Digest, available in EUROCONTROL library.
4.3 When to use the input?
It is recommended to use all causes of delay provided by CODA when analysing the impacts on airlines or on passengers/society (e.g., an airline upgrading the avionics in their aircraft; airport expansion, etc.). On the other hand, ATFM delay is recommended to be used when analysing projects aiming at improving flow management. Since primary delay shows the delay that is due to direct triggers, it is recommended to be used when analysing updates that would impact the non-reactionary delays.